

The Phase Response Curve (PRC) is a curve describing the relationship between a stimulus, such as light exposure, and a response, in this case a shift in circadian rhythm (phase shift).
A phase shift in your circadian rhythms means that your bedtime and wake-up time will move earlier in the day (phase advance) or later in the day (phase delay). The PRC is important because it can determine when to time light and melatonin correctly in order to advance (or delay) your circadian phase.
Many of us have heard that light exposure in the morning advances your rhythm (shifts it earlier), whereas light exposure in the evening delays it.
But how much earlier or later? That depends on the time of exposure, and that is what the PRC reveals. Of course, it also depends on how bright the light is,
how long the exposure, the color of the light, and whether the subjects' sleep episode is shifted during the study and by how much.
PRC for One Hour Light Exposure
What the graph shows:
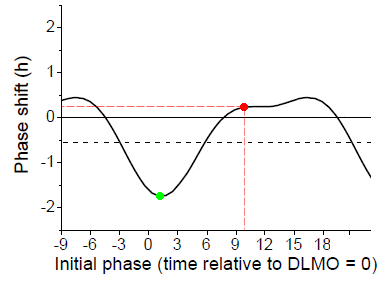
Here is a PRC published in 2012 [Ref 1] for a one hour light pulse, such as might be used in light therapy treatment, using white light at 8,000 lux from fixtures covering the ceiling, and measured for normal sleepers.
The horizontal axis is the time of the exposure, measured in hours, with zero at Dim Light Melatonin Onset (DLMO). Normal sleepers, on average, would fall asleep about 2 - 3 hours after DLMO and wake up about 10 - 11 hours after DLMO. The vertical axis is the measured phase shift in circadian rhythm. A phase advance (shift to an earlier time) is up (positive numbers) on the chart. The researchers report the midpoint of the light exposure, rather than the start time, so that is what the labels on the horizontal axis refer to.
We've marked a point in red corresponding to light used on awakening. Light at this time resulted in an average of only 15 minutes of phase advance. Light six hours later appears to show a bit more of a phase shift, about half an hour advance, but we think that's an artifact of the curve fitting procedure [Ref 1 Eq 1]. Nevertheless, the light produced a phase advance (moved the rhythm earlier) even when used in the early afternoon. Earlier studies which seemed to indicate that light had to be used immediately on arising used longer light exposure (see next section).
The same amount of light in the evening shows a two hour phase delay (pushes the circadian clock later), marked in green.
What is the black horizontal dashed line? Recall that in the absence of the usual light/dark cycle and any other time cues, the average period of the circadian rhythm in normal sleepers is about 24.18 hours [Ref 2]. So we would expect that over the three day course of the phase shift measurement, the average subject's rhythm would have delayed by about half an hour (0.54 hours). (The way the experiment was designed, the phase shift was measured as the difference between a complex "constant routine" measurement of phase before the day of the light exposure and a similar measurement three days later.) In fact, the reported PRC looks much more symmetric around that half hour delay (the dashed line). The light in the early part of the day advances the cycle by about the same amount as light in the evening delays it. It's just that half an hour of that advance (produced by ONE exposure to the light pulse) was "used up" by the three days of intrinsic circadian drift (delay) experienced during the three days of the measurement process.
In other words, one can assume that the one hour light pulse upon awakening actually advanced the phase by about 45 minutes. 10 minutes of that was "used up" by the intrinsic circadian drift each day during the three day measurement process, resulting in a change in clock time of the body's circadian rhythm of only about 15 minutes.
For DSPS patients it is believed that their intrinsic circadian rhythm is longer than for normal sleepers. For Non-24 people, longer still. So even more of the phase advance provided by the light gets "used up" just entraining to 24 hours. An average intrinsic circadian cycle for one sample of DSPS patients has been measured to be about 24.6 hours [Ref 3]. So even if light produces the same total phase advance as for normal sleepers, about 45 minutes, 35 minutes of that is "used up" just entraining to a 24 hour day. That leaves only 10 minutes actual advance in clock time. Of course, this is based on averages. Some individuals will experience less of an advance, some more.
In addition, the experimental protocol involved a forced advance of sleep time - see below.
To indicate the approximate nature of the data, we've added the same chart but with the individual data points shown:
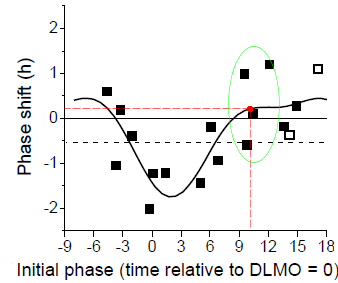
For example, the red dot in the previous graph and this one is the result of curve fitting primarily to data from four individuals, shown inside the green oval. One showed a delay of about half an hour, one had no change, and two showed advances of about an hour. That's what gave rise to the average 15 minute advance.
PRC for 6.7 Hour Light Exposure
Some of you may remember seeing a chart with much larger phase advances. I've reproduced it here in order to discuss the differences:
This graph shows light on awakening advancing one's circadian clock by nearly 2 hours (red dot) - but that's with 6.7 hours exposure, and a forced advance of sleep time (see below)!
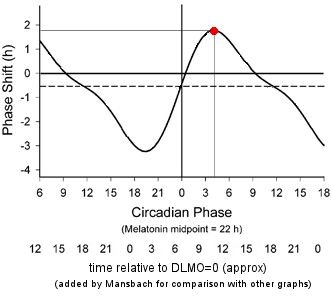
It's from a 2003 paper [Ref 4]. But this is the response to a light "pulse" of 6.7 hours! The measurement procedure was similar to that for the one hour PRC, and also used white light, 5,000-10,000 lux in this case, and normal sleepers. The axes are similar, but note that the times are for the center of the 6.7 hour pulse, and the original zero point is at the core body temperature minimum, CBTmin. We've added numbers below the original axis to represent approximately the time relative to DLMO, to be comparable to the other graphs on this page. This is based on a typical DLMO being at roughly 7 hours before CBTmin.
We've marked a point in red at the maximum advance, occurring around 4 hours after CBTmin. Light at this time induces a phase advance of about 2 hours. But keep in mind that this time refers to the midpoint of the 6.7 hour light exposure, so the light exposure was actually started about half an hour after CBTmin, before the subject's normal wake up time.
The 6.7 hour light duration seems more representative of someone who is outdoors all day, rather than someone sitting in front of a light box.
Again note that the experimental protocol involved a forced advance of sleep time - see below.
Other earlier measurements of the PRC also used long light durations, at least 3 hours [Refs 5,6,7].
In recent years it has been established that blue light is most effective in shifting circadian rhythm, at least for normal sleepers. In a 2012 paper [Ref 8] the authors develop a PRC for blue light.
The big news here is that these data were obtained using 185 lux of blue light. By comparison, the PRCs shown above were obtained with 5,000 - 10,000 lux of white light. There are two reasons for this large difference. One is that lux measures perceptual brightness, that is, how bright the light appears in human vision. Because the visual system of rods and cones is relatively insensitive to extreme blue light, 185 lux of blue light from the source used in this study (peak intensity at 467nm, mostly between 450 - 500 nm) has the same physical energy as about 1500 lux of yellow-green light (see e.g. my discussion of lux). Of course, we're not interested here in visual perception by rods and cones, we're interested primarily in the effect of the light on the ipRGCs (intrinsically photosensitive Retinal Ganglion Cells) that have the biggest influence in shifting circadian rhythm. So the energy of the blue light is more significant than its perceptual intensity (lux). The second reason, of course, is that blue light is more effective in shifting circadian rhythm than white light, via the ipRGCs.
(Aside: I would also suggest that inexpensive lux meters are probably not very accurate in measuring blue light, since it normally doesn't contribute much to a typical lux measurement.)
This graph is for three days of light exposure, so one day would only shift about a third as much.
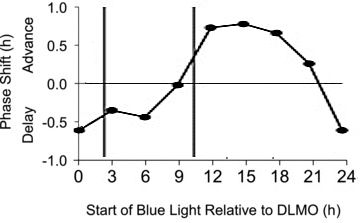
This PRC was developed using a total of 90 minutes of exposure (in three 30 minute sessions with 15 minutes between sessions) to 185 lux blue light (from a commercially available Philips goLITE BLU) for three days (the first two light PRCs we showed above used one day of light). The vertical bars indicate a typical sleep period, starting about 2 hours after DLMO and ending about 8 hours later. In this case phase shifts due to blue light were derived by subtracting the phase shift measured on placebo, so we don't need to add a horizontal dashed line (as we did for the white light PRC) to account for drift with no stimulus.
In this study the sleep time was not shifted as it was in the two white light studies discussed above (see below).
Note again that significant phase advances resulted from using the light as late as early afternoon (for normal sleepers).
The light source used was small and focused, and it's very easy to move out of range so that the light no longer shines directly at your eyes. The research assistants made sure that the subjects remained in position to receive the maximum light. Patients using these lights must take care not to move away from the bright area.
The variability among individuals is again seen in the plot of the individual data points which give rise to the above PRC:
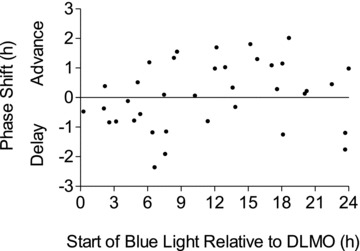
The individual data points were collected into "bins" 3 hours wide, and all the points in the bin were averaged together. The resulting values were plotted at the midpoints of the bins, and straight lines were drawn between these points, to form the previous graph. So there is a lot of uncertainty in the results (this is the case for any of the PRC curves measured to date), and details of the curves are not to be taken too literally.
As a result there is no dot on the chart for starting light immediately on arising, which would be about 11 hours after DLMO. There is a point for starting light 12 hours after DLMO, corresponding to about an hour after arising, and this point is itself an aggregate which include a 3-hour window of start times.
Individual responses may be quite different from these fitted averages.
The effects of melatonin also vary by time of administration, as well as by dose. Melatonin affects phase in the opposite sense, compared to light: melatonin early in the day delays the circadian rhythm; late in the day it advances the rhythm. Here is a PRC for 0.5 mg melatonin administered over 3 days [Ref 9]:
This graph is for three days of melatonin, so one day would only shift about a third as much. For 0.5 mg melatonin (dark solid line), maxmum advance over three days was about 1½ hours, achieved when the melatonin was taken about 6 hours before bedtime (red dot):
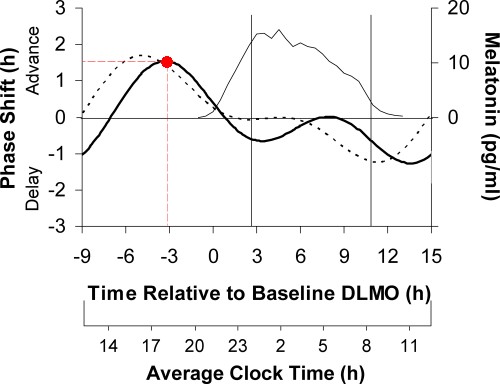
Note that this measures phase shifts due to three days of melatonin. The horizontal axis is the time, with the zero at Dim Light Melatonin Onset (DLMO), similar to the 1 hour light PRC. The thin line (topmost curve) represents the natural (endogenous) secretion of melatonin. The effect of taking melatonin during the time when it is already being produced by the body is minimal. This PRC is for normal sleepers.
Again, phase shifts due to melatonin were derived by subtracting the phase shift measured on placebo, so we don't need to add a horizontal dashed line (as we did for the white light PRC) to account for drift with no stimulus. The dotted curve is based on a similar study but using 3 mg melatonin. The phase advances are similar for the two doses, but the larger dose is best taken earlier, and also results in more drowsiness during the evening, so most patients prefer the smaller dose.
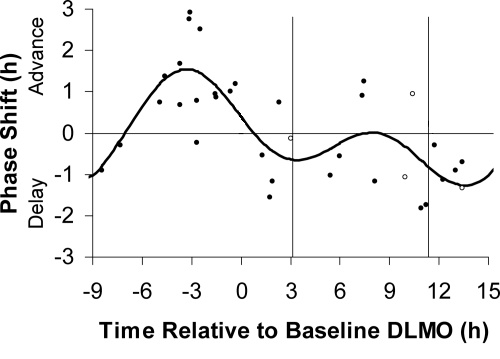
We've also included a plot from the same paper showing the individual data points from different subjects, to illustrate the variability of individual responses. For example, near the peak phase advance of 1.5 hours on average, different individual subjects advanced anywhere from 0 to 3 hours.
Since so many variables can affect the circadian rhythm and the secretion of melatonin, some rather complex and difficult experimental techniques have been developed to isolate the variables of interest.
One procedure that is common to the studies above is the use of a "constant routine" (CR) or similar procedure in the determination of the time of DLMO, and hence the phase shift (time shift) of the circadian rhythm in response to the stimulus. This is needed because certain behaviors such as eating, sleeping, and activity can alter rhythms such as the circadian variation in melatonin levels. The need for a CR procedure has been described by Duffy and Dijk [Ref 10]. They describe the CR as follows:
"The ideal constant routine therefore requires study subjects to remain awake throughout, in a constant posture, restricted to very low activity levels, with nutritional intake distributed throughout day and night."(Some of the studies above did not enforce the distributed nutritional intake as rigorously as others.) Technicians must be present at all times to assist the subjects in maintaining wakefulness and to ensure protocol compliance.
This is a pretty restrictive and difficult procedure for the subject, especially the enforced wakefulness. Furthermore, the CR generally extends for at least 24 hours and in some measurements considerably longer (as much as 65 hrs in Ref 4).
Note that the CR (or similar procedure) is used for the measurement of DLMO before and after the light or melatonin treatment. It is not used on the day(s) of light or melatonin treatment.
This is an area where the studies above used different strategies, which may have contributed to differences in the results.
For the white light PRCs described above [Refs 1 and 4] the experimenters arranged for the light exposure to occur centered within a wake period of 16 hours, with 8 hours of sleep on either side. In order to achieve this the constant routines before and after the exposure days were extended. The time of the resulting sleep periods before and after the light exposure was therefore forced to be different from the subjects prior sleep hours, either delayed or advanced, in some cases by many hours.
For example, for the data point involving 1 hr light exposure starting on arising, the sleep periods before and after the light exposure would have been about 7.5 h earlier than the subject's usual sleep time before the study. So the subject was forced to advance his or her sleep time abruptly by 7.5 h during the measurement period.
It has been suggested [Ref 8] that "even if bright light was not applied the circadian rhythms would gradually phase advance or phase delay to re-entrain to the shifted sleep/dark episodes." In other words this imposed delay or advance of sleep hours may have affected the observed phase shift, in addition to the effect of the light which was to be measured. This procedure can therefore be seen as a "re-entrainment protocol" in which the sleep phase is shifted, and the measured phase shift reflects the degree that the light re-entrained to the shifted sleep time, which in turn depends on the time of the light exposure and the degree of shift of the sleep period.
For the blue light PRC [Ref 8] subjects were given phase assessments lasting about 24 hours, similar to constant routines, before and after 3 days' worth of 4 hour ultradian (shorter than a day) sleep-wake cycles (1.5 hrs sleep, 2.5 hrs wake). The light exposure occurred at the specified times during the 3 days of ultradian cycling. Since the subjects' sleep hours were not shifted during the protocol, the measured phase shift (the shift in time of DLMO) may be more representative of the phase shift due to the light exposure alone.
Each subject participated in the protocol twice, once with the light exposure (stimulus) and once without (placebo). For each individual, the DLMO shift measured in the placebo case was subtracted out from that measured with the stimulus, to eliminate any effect due to the protocol itself (assessment phase and ultradian schedule). Thus, the PRC shows the phase shift due to the light exposure alone.
Similarly, for the melatonin PRC in Reference [9], subjects were given 24 hour phase assements and 3 days' worth of 4 hour ultradian sleep-wake cycles (1.5 hrs sleep, 2.5 hrs wake). The melatonin was administered at the specified times during the 3 days of ultradian cycling. Again, the sleep hours were not shifted during the protocol, and the phase shift during the placebo session was subtracted out to leave the phase shift due to just the melatonin.
It is understandable that the researchers need to go to great lengths to try and isolate the phase shifting effect of light (or melatonin) from all the other factors that can influence melatonin secretion and sleep. But the resulting experience is not anything like a normal night's sleep or a normal use of light (or melatonin) for phase shifting therapy. Whether the protocol shifted the sleep time or avoided that by using short ultradian sleep/wake cycles, in neither case is the application of the light like normal daily therapy. And the constant routine period before and after is yet another disruption.
The resulting PRCs should therefore be understood as guidelines for therapy, with the understanding that results may be different in practice. Further, when the large variability from subject to subject is noted, and when even those results are then taken and averaged and fitted to a curve, one should not expect any individual's response to a therapy regimen to lie right on the curve.
